The Relationship between Weather and Yelp Reviews
I. Data Science Problem
a. Our Big Idea
Does the weather affect people's moods so much that they will rate restaurants lower or higher? Do people write more positive, five-star reviews on nice days because they are in a better mood? Does good weather lead to people have better experiences at restaurants, and lead to positive reviews? In either case, we know people are affected by the weather in general - but want to investigate if this effect is detectable in restaurant reviews.
A few applications to this data science problem:
Marketing
For the restaurant, if they knew this correlation to exist, they could use weather-based marketing to help compensate for any negative effect. Restaurants could change the atmosphere to create a better mood or offer services depending on weather. For example, "It may be rainy outside, but it's sunny in here!" or "It's 100 degrees outside, so come enjoy a free frozen lemonade with any entree purchase".
More accurate information
Restaurants and restaurant-goers both make decisions from Yelp reviews. For Yelp to provide better information to its consumers, they could weigh the reviews based on the weather to account for any possible weather effect.
b. Previous Research
Previous research explores the relationship between people's behavior and the weather. In 2013, Horanont, et al. [1] use GPS location traces on mobile phones to passively track behavioral patterns in different weather. The researchers find many detectible differences in behavior, including that people tend to stay at restaurants longer in colder weather.
Some research focuses specifically on the effect of weather on how people rate and review businesses. Agarwal and Xu [2] discuss the effect of weather on people's mood on their Yelp business reviews and ratings. Weather was measured by rainfall, humidity, temperature, and wind speed. The authors conclude that there is an impact, however, more sophisticated research is needed.
Bakhshi, et al. [3] study 1.1M Yelp restaurant reviews to determine influencing factors. They find that external factors - especially weather - significantly affect the customer's review and rating of restaurants.
II. Collecting New Data
We pulled data from three sources: Yelp.com, Census.gov, and NOAA.gov. All provide rich data that is free and accessible.
a. Yelp and Census data
We used Yelp's API to collect data from restaurants across the US. Yelp limits API calls to 20 restaurants per US County with 3 reviews (in full text) per restaurant. Since we wanted a large sample of reviews from across the US, we pulled Yelp data for 300 US counties.
We used Census data to access a clean list of US counties by population. We used the requests package to access the CO-EST2016-alldata.csv file and imported it as USA_Counties_RawData.csv. We sorted this data by population and used the top 300 counties to feed into the Yelp API.
We used the Yelp API (based on the 300 counties) to generate two datasets, Reviews and Detail. Yelp Reviews data (Restaurant_Reviews_RawData.csv) provides full text reviews by restaurant, with the rating, date, username of the reviewer, and URL link to the review. Yelp Detail data (Restaurant_Details_RawData.csv) provides restaurant-level details, including latitude and longitude, address, city, phone number, category (pizza, tacos, etc.), price range, overall star rating, and number of reviews.
b. Weather data
NOAA makes their data publicly available through an FTP system. We found that many other historical weather datasets are not free - making NOAA the best option.
To access the NOAA data, we used the ftplib package in Python3 to transfer the files. We collected two files, 2017.csv.gz and ghcnd-stations.txt.
2017.csv.gz is a large datafile containing daily weather measurements from weather stations across the world for 2017-to-date, including precipitation, temperature, and snowfall. ghcnd-stations.txt is a reference file, providing details about each weather station. We merged the datafiles to append the latitude and longitude for each station, resulting in one file 2017_Weather_RawData.csv.
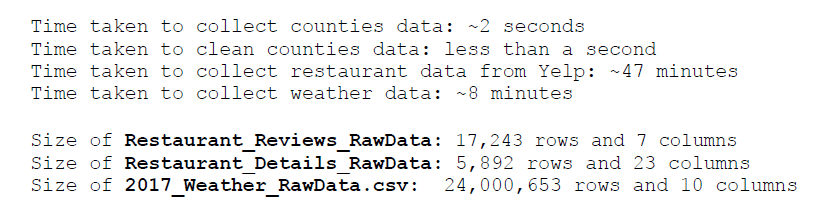
b. Summary of collected data
After completing the collection process, we had three datafiles to work with:
Restaurant_Reviews_RawData.csv, Restaurant_Details_RawData.csv, and
2017_Weather_RawData.csv. The collection times and file sizes are:
III. Potential Analysis using Collected Data
We have ~17,000 Yelp reviews from ~5,800 restaurants across the US. We have daily weather measures (precipitation, snow and temperature) from 7,711 weather stations across the US. We will merge the datasets (by latitude and longitude) to investigate the relationship between the reviews and the weather. The principal analysis will be to compare weather measurements (precipitation and temperature) with the sentiment of the Yelp review and the Yelp rating by date and location.
We will use sentiment analysis on the text of each review to gauge the level of positivity. We will use the Python3 package textblob based on the Natural Language Toolkit (NLTK) to do this analysis.
Since the Yelp data is rich beyond the review text and star ratings, we can also investigate the effect of the restaurants price range, the restaurant category, and whether the restaurant accepts reservations.
Given that we have data from across the country for all of 2017-to-date, we could also investigate regional differences and seasonal differences. For example, the relationship between weather and reviews may be stronger in areas with larger weather variations versus those without (Northeast vs. Southern California).
IV. Cleaning the Data (& Data Issues)
a. Yelp Reviews data
For the Yelp Reviews data, we reduced the size of the datafile and did some cleaning.
The cleaning included:
- Dropped unnecessary columns
- Converted date format (to match with date format in the weather data)
- Checked date range, and dropped reviews not from 2017
- Checked for missing values, which there were none
b. Yelp Detail data
For the Yelp Detail data, we also reduced the size of the datafile and performed some quality checks.
The data preparation included:
- Dropped unnecessary columns
- Dropped rows for restaurants with no reviews
- Combined three location address columns into one column
For quality checks, we checked for missing values for all columns. Only one restaurant had missing latitude and longitude - we researched the restaurant "Milya cafe" to determine its coordinates. We wrote code to repair that row with the appropriate data. Other missing values are not a problem, as those columns are not necessary for analysis.
Lastly, we found bad data in the 'transaction' column, so we removed all values that began with "http". We also removed all brackets from the values in that column.
c. County data
To prepare the county data, we reduced the size of the data and transformed it so that we could feed it into the Yelp API for data collection. This process included removing unnecessary columns and unnecessary rows, for example, state-level population measures.
This dataset was clean, we did not detect any anomalies, as expected given its reputable source. We performed quality checks including: checking the minimum and maximum values and the difference in population from 2015 and 2016 estimates. Even for the most extreme population gain, was only a +2% increase.
d. Weather data
The weather data included 52 measurement types from weather stations across the world. We reduced the data to US weather stations only and performed some cleaning. The data did not have many accuracy issues, we only dropped a few measurements for questionable accuracy.
The data preparation included:
- Dropped unnecessary columns
- Dropped rows with values in column 5 which was a quality flag
- Dropped all weather measurements except for precipitation (PRCP), snow (SNOW), and temperature (TAVG, TMIN and TMAX) since those are the most common
- Reformatted the dates, and temperature measure to °C
- Reshaped the data so that we had a column for each measure, and dropped rows that did have values for at least PRCP and TAVG or TMIN and TMAX
The quality checks included:
- Checked temperature range by looking and its range and histogram. Outliers were checked by hand. For example, the maximum temperature is 52.8°C/ 127.04°F - and that was confirmed as coming from the Death Valley weather station.
- Checked precipitation values by looking at its range and histogram. Outliers were checked by hand. For example, 463.6 mm (18 inches) of rain on August 30, 2017, which was confirmed as coming from a southeastern Texas weather station during Hurricane Harvey.
Although extreme values exist in the weather data, we feel confident in their accuracy and decided not to drop any. However, there were instances for which the TMIN was greater than TMAX, we dropped those rows.
Finally, we checked for valid date ranges, valid latitude and longitude, and missing values. No other issues were detected.
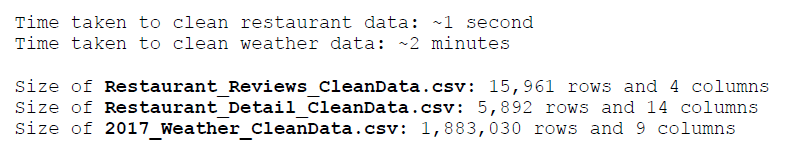
e. Summary of cleaned data
After completing the cleaning process, we had three datafiles to work with:
Restaurant_Reviews_CleanData.csv,
Restaurant_Detail_CleanData.csv, and
2017_Weather_CleanData.csv. The cleaning times and file sizes are:
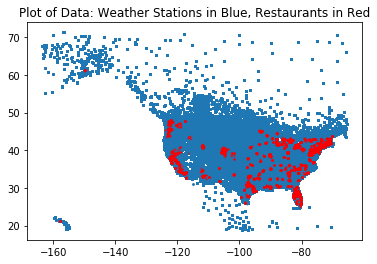
Lastly, we mapped our data by latitude and longitude. The weather stations are in blue dots, the restaurants are in red dots. The restaurant data is spread across the US, with more data in more populous areas. The weather stations are dense, which should provide us with robust weather data for the analysis portion.
V. Bibliography
[1] Teerayut Horanont, Santi Phithakkitnukoon, Tuck W. Leong, Yoshihide Sekimoto and Ryosuke Shibasaki, "Weather Effects on the Patterns of People's Everyday Activities: A Study Using GPS Traces of Mobile Phone Users", NCBI, vol. 8, no. 12, December, 2013.
[2] Nitin Agarwal, Kevin Xu, "Social Computing, Behavioral-Cultural Modeling, and Prediction", 8th International Conference, SBP 2015, Washington, DC, 2015, pp.416
[3] Saeideh Bakhshi, Partha Kanuparthy, Eric Gilbert. "Demographics, weather and online reviews: a study of restaurant recommendations," WWW '14 Conference, Seoul, South Korea, 2014, pp. 443-454.